

From YouTube Video to Sketchnote Infographic
Building an Automated Infographic Generator with n8n, AI, and Cloud Hosting
Content creators spend hours turning long YouTube videos into summaries, slides, and visuals. This workflow solves that problem end to end. With a single video link, it automatically extracts the transcript, summarizes the content, generates a high quality sketchnote style infographic, hosts the image, and returns a shareable link to the user.
All of this happens without manual intervention.
Let’s walk through how this system works and why each component matters.
The Big Idea
The goal of this workflow is simple:
Convert any YouTube video into a visually rich, whiteboard style infographic using AI.
Behind the scenes, it combines transcription, content intelligence, image generation, and cloud delivery into one seamless pipeline.
The entire flow is built using n8n, making it easy to extend, debug, and scale.
User Entry Point: Form-Based Trigger
The workflow starts with a form trigger.
What happens here
-
The user sees a simple form titled Infographic Creator
-
There is a single required input: YouTube Video Link
-
On submission, the workflow kicks off immediately
This keeps the UX clean and removes friction. No logins, no complex inputs, just paste a link and submit.
Step 1: Extracting the YouTube Transcript
Once the form is submitted, the workflow sends the video link to an external transcript service powered by Apify.
Why this step matters
-
AI works best on clean text
-
Video audio is noisy and unstructured
-
Transcripts provide a reliable foundation for analysis

What the HTTP request does
-
Calls a YouTube Transcript Scraper actor
-
Passes the video URL dynamically from the form
-
Receives a structured transcript with time stamped text segments
At this point, the workflow has the raw knowledge from the video.
Step 2: Turning Transcript into Structured Intelligence
Next, the transcript is sent to a large language model using OpenAI with the GPT-5 model.
The AI’s task
The model is instructed to produce:
-
A clear title
-
A core thesis in 8–10 lines
-
4–6 mental models or key arguments
-
A short conclusion
There is also a hard character limit to ensure concise output.
Why this step is critical
This structured summary becomes the blueprint for the infographic. Without it, the image generator would produce cluttered or inaccurate visuals.
Think of this step as converting raw information into an architectural plan.
Step 3: Generating the Sketchnote Infographic
With the structured summary ready, the workflow moves into image generation.
Visual design constraints
The prompt enforces strict visual rules:
-
Hand drawn marker style on a whiteboard
-
Bento box layout with hand drawn borders
-
Perfectly legible handwritten typography
-
High information density without chaos
-
Color coded sections using cobalt blue, emerald green, sunset orange, and deep purple
Content structure enforced
-
Large double underlined title at the top
-
“Key Themes” line under the header
-
4–6 boxed panels with:
-
Colored section headers
-
Simple diagrams like graphs or cycles
-
3–4 bullet points each
-
-
A future or conclusion box in the bottom right
This ensures every generated image is consistent, readable, and professional.

Step 4: Hosting the Image in the Cloud
Once the image is generated, it needs to be accessible.
That’s where Cloudinary comes in.
What happens here
-
The image is uploaded using multipart form data
-
An unsigned upload preset keeps things simple
-
Cloudinary returns a secure, publicly accessible URL
This URL becomes the final output delivered to the user.
Step 5: Returning the Result to the User
The last node completes the loop.
-
The workflow redirects the user to the hosted image
-
No waiting, no downloads, no email follow ups
-
The user instantly sees their infographic
From input to output, the experience feels fast and polished.
Why This Workflow Is Powerful
This setup is more than a cool demo. It solves real problems.
For creators
-
Turn long videos into shareable visuals
-
Repurpose content for LinkedIn, X, blogs, and presentations
-
Save hours of manual summarization and design
For educators and consultants
-
Convert lectures into teaching visuals
-
Create explainers without design tools
-
Maintain consistency across materials
For product teams
-
Generate visual summaries for demos and documentation
-
Improve internal knowledge sharing
-
Automate content workflows at scale
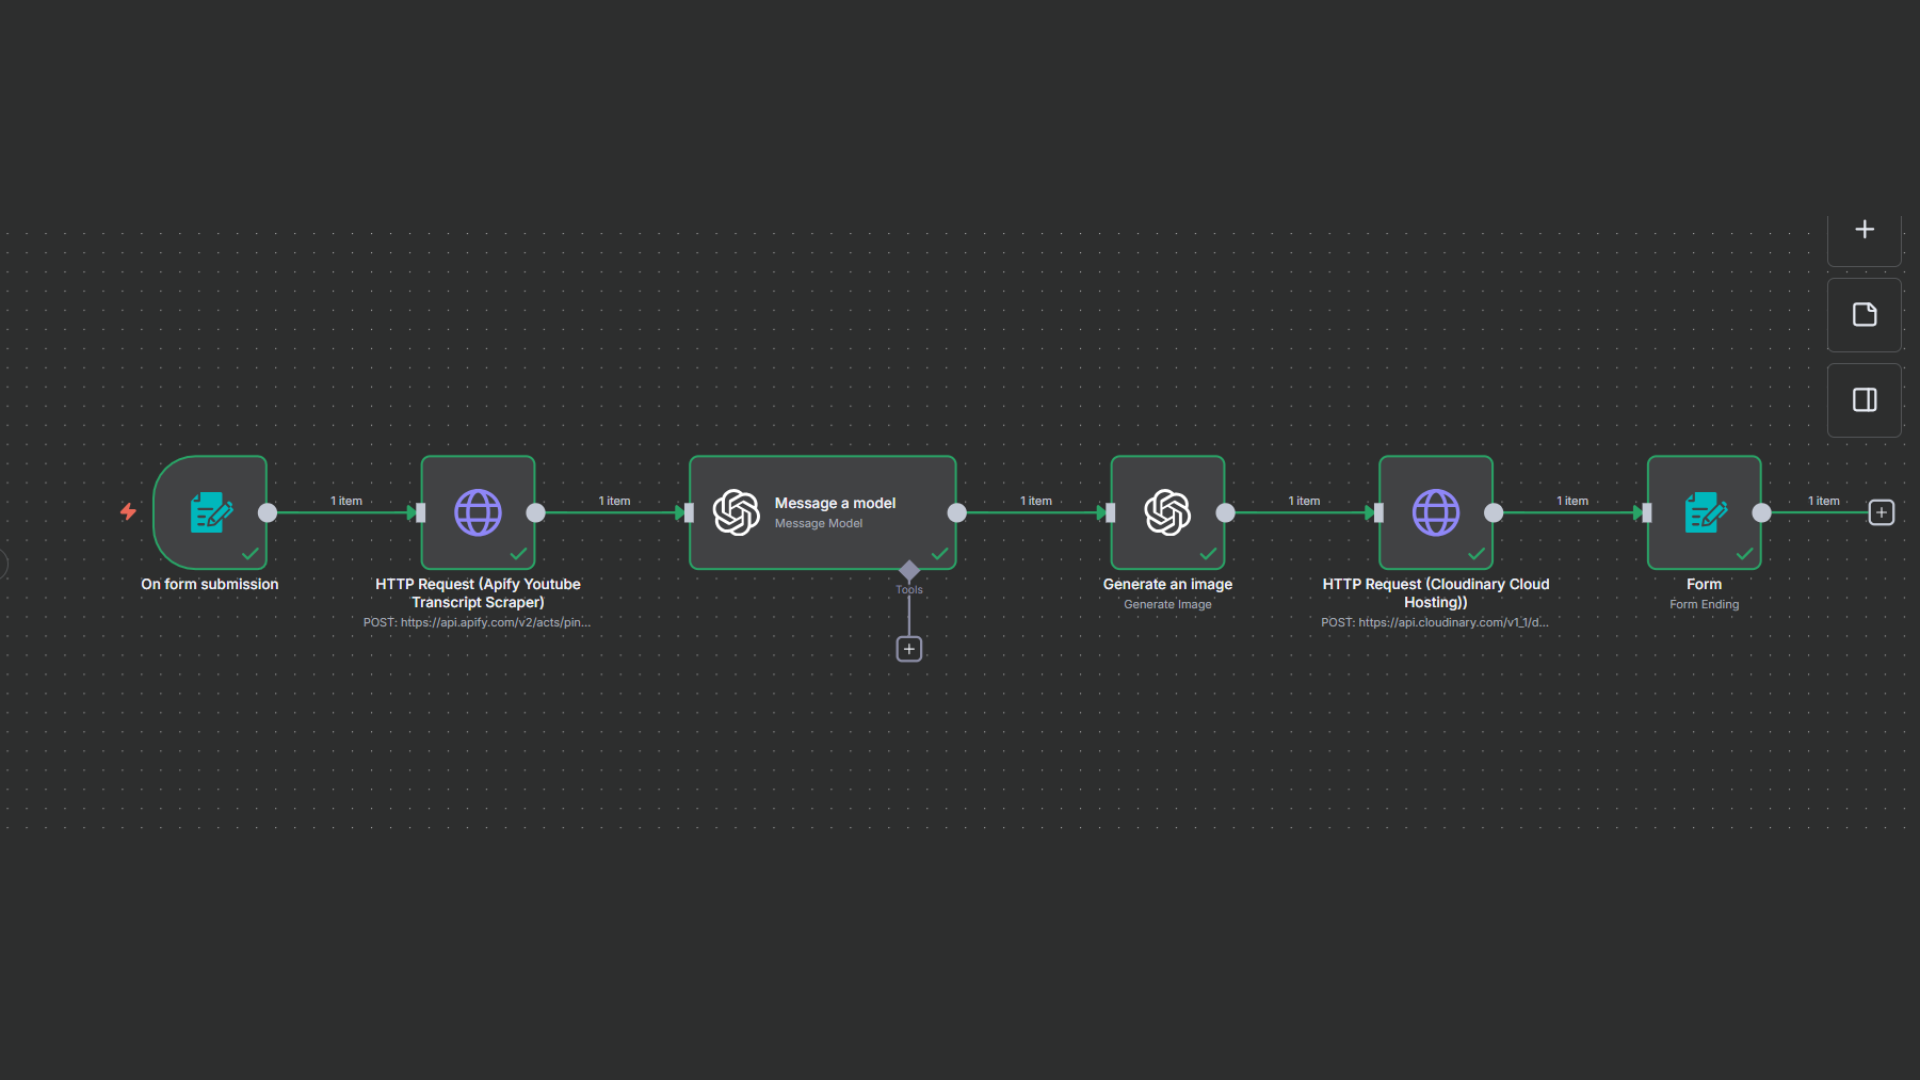
Architecture at a Glance
-
User submits a YouTube link
-
Transcript is fetched via Apify
-
GPT-5 extracts structured insights
-
AI generates a sketchnote infographic
-
Cloudinary hosts the image
-
User receives a shareable link
Each step is modular, making it easy to replace or upgrade individual services later.
Final Thoughts
This workflow shows how far automation has come.
By combining no code orchestration, large language models, and generative visuals, you can transform raw content into polished assets in minutes.
The real win here is not just speed, but consistency. Every output follows the same visual and cognitive structure, which is exactly what modern content teams need.
If you’re building tools for creators, educators, or businesses, this pattern is worth stealing.
Want to know more or build a solution that fits your needs? Get in touch with us.
Email: operations@growglobal.io
Phone No.: +91 9144191440
Want to know more or build a solution that fits your needs? Get in touch with us.
Email: operations@growglobal.io
Phone No.: +91 9144191440